If you would like to see me do this in video form, please go here: https://youtu.be/Hx5sMPon42k
----------------------------------------------------------------------------------
Note: This instructional is just an outline of how I begin looking at a "slow SQL query". It's aimed at "full stack developers" or other people who are trying to get started in looking at SQL performance tuning. All the software I show here is free, and I do not receive any form of referral fee. And links to scripts that I used are also credited.
So ... with that out of the way, let's begin!
Let's assume we work as a developer and we're calling a SQL stored procedure named QueryResultsGet. Here is a sample of the call, and the data:
You can see there that this took 15 seconds to run, to return 168 rows.
So the question is ... is 15 seconds a valid time to wait for this number of rows? Obviously, for the sake of this demonstration, we're going to say no.
So what do you?
Well, here is what I do.
The first thing I do is ensure I'm in a test environment that is as close as possible to Production. Normally I would use a UAT instance that was recently refreshed with live data. This is because I want to make changes to the code and/or underlying schema, and don't want to affect Production. But I also don't want to use a Dev environment, because often they've been hacked by developers and the size of the data could cause very different results.
Next, I am going to take a snapshot of the current results. These "results" include not just taking note of the 168 rows returned, but a few other things.
I want you to get a SQL query, any query that does a few joins will do, and then type this above it:
SET STATISTICS IO ON;
Next, I want you click this button on the tool bar:
And then run the query again ... Now that you've re-run it, a couple of extra things happened that didn't happen before.
Firstly, when you click the Message tab in the results panel, it displays a whole lot more information than it showed before.
(If you want to compare, change your code to be SET STATSTICS IO OFF; and re-run)
Here is what the Message tab shows in this example:
Now ... I want you to download a an application called WinMerge, or go to a site called https://www.diffchecker.com ... or anything similar. There are lots to choose from. I'm a creature of habit, and have been using WinMerge for years and so it's my default. Regardless of what you chose, please copy/paste that text on the left pane:
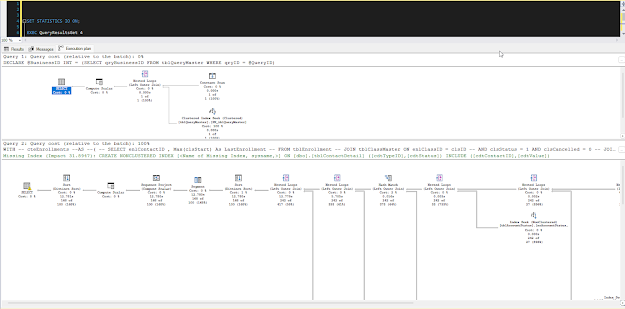
The other thing that I asked you to do was turn on the Actual Execution Plan, and that would've resulted in a 3rd tab appearing in the results pane. When you click it, you'll see something like this:
Now, I don't know about you ... but that's rather hard to read, and make sense of ... so instead of using that, download SQL Sentry Plan Explorer from here https://www.solarwinds.com/free-tools/plan-explorer Once you've done that, right click the plan in SSMS and show the plan XML. This will open a new tab were you can copy the XML.
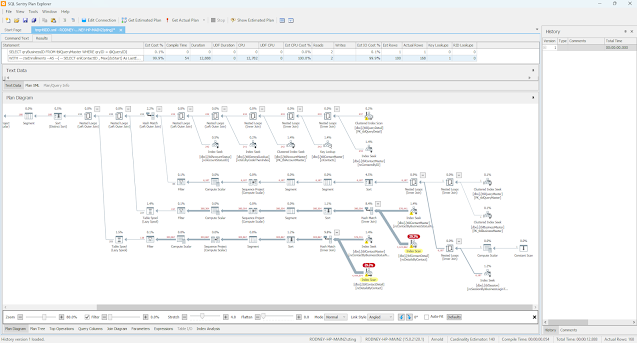
Finally, paste that XML into SQL Sentry Plan Explorer and you should be able to see it like this:
(Note: there is also the option to get the SSMS plug-in which means you can right-click in SSMS and open in SQL Sentry Plan Explorer straight away).
Look at how much easier that is to read!!!
Why Microsoft hasn't updated the SSMS Execution Plan diagram is a mystery to me.
Immediately when you look at this image, you can see the red and yellow highlighting. This free software is doing my job for you! It's saying exactly where there is overhead.
In this case it's highlighting tblContactMaster and tblContactDetail ... And now I want you to look for those two tables in the statistics that we saved into our text comparison software:
Table 'tblContactDetail'. Scan count 342, logical reads 399798, physical reads 0, page server reads 0, read-ahead reads 0, page server read-ahead reads 0, lob logical reads 0, lob physical reads 0, lob page server reads 0, lob read-ahead reads 0, lob page server read-ahead reads 0.
Table 'tblContactMaster'. Scan count 589, logical reads 28836, physical reads 0, page server reads 0, read-ahead reads 0, page server read-ahead reads 0, lob logical reads 0, lob physical reads 0, lob page server reads 0, lob read-ahead reads 0, lob page server read-ahead reads 0.
So ... that's the problem, what's the solution?
Well ... this is the thing ... you've now found "a problem", not "the problem" ... chances are that a query taking 15 seconds to return only 168 rows has a few issues! But for the sake of this demo, let's keep it simple.
The only advantage I see in the Microsoft Execution Plan display, is that it highlights missing indexes. Sentry Plan Explorer has this hidden (for a reason I can never explain). But anyway, go back and look at the the Microsoft one ... see the green text?
If you right click the green "Missing Index" and then select Missing Index Details ... it will open a new tab with a script to create the index.
Now we come to the interesting part ... do you create the index?
Probably ... if you create the index that it suggests, then it will make THIS query go quicker. But ... indexes take on overhead .. the more indexes you have then the more storage you use and the slower some updates take to do. You don't want to go blindly creating indexes, just to speed up one query which may only get run weekly?
BTW - Brent Ozar does a great, and hilarious, job of explaining what he calls "Clippy" and the index suggestions in this video here - https://www.brentozar.com/archive/2020/07/video-how-to-think-like-clippy/
Therefore before blindly creating an index, please copy paste this script from Pinal Dave, and see what other indexes are on this table:
DECLARE @ObjID BigINT = (SELECT ID From Sys.SysObjects WITH (NOLOCK) WHERE Name = 'type_your_table_name_here'); --
;
WITH cteFrag AS
(
SELECT object_ID, index_id, index_type_desc, MAX(avg_fragmentation_in_percent) AS FragPct
FROM sys.dm_db_index_physical_stats(DB_ID(), @ObjID, NULL, NULL, NULL)
GROUP BY object_ID, index_id, index_type_desc
)
SELECT
o.name AS ObjectName
, i.name AS IndexName
, i.index_id AS IndexID
, dm_ius.user_seeks AS UserSeek
, dm_ius.user_scans AS UserScans
, dm_ius.user_lookups AS UserLookups
, dm_ius.user_updates AS UserUpdates
, p.TableRows
, i.is_primary_key
, i.type_desc
, cteFrag.FragPct
FROM sys.objects o with (nolock)
LEFT JOIN sys.dm_db_index_usage_stats dm_ius with (nolock) on dm_ius.object_id = o.object_id
LEFT JOIN sys.indexes i with (nolock) ON i.index_id = dm_ius.index_id AND dm_ius.object_id = i.object_id
LEFT JOIN sys.schemas s with (nolock) on o.schema_id = s.schema_id
LEFT JOIN (SELECT SUM(p.rows) TableRows, p.index_id, p.object_id
FROM sys.partitions p with (nolock) GROUP BY p.index_id, p.object_id) p
ON p.index_id = dm_ius.index_id AND dm_ius.object_id = p.object_id
LEFT JOIN cteFrag ON dm_ius.object_id = cteFRAG.object_id
AND dm_ius.index_id =cteFRAG.index_id
WHERE OBJECTPROPERTY(dm_ius.object_id,'IsUserTable') = 1
AND dm_ius.database_id = DB_ID()
AND i.object_id = @ObjID
ORDER BY ObjectName, IndexName;
If this table already has lots of indexes on it (5 is an average number), then consider if what the green text is suggesting can be changed to just a modification of an existing index, before just blindly creating it.
For the sake of this demo though, let's assume that this table has only 2 indexes, and none of them are like what is suggested, and so we're going to create it.
So ... create the index and go back, and run the query again ...
For this demonstration, here are the main results:
168 rows, in only 5 seconds!
So, that's good, right?
Well ... yes ... but ... let's not get too ahead of ourselves ...
The rows are the same, because we didn't alter how the actual query works. It's always important when changing the logic of the code that we get the correct data foremost.
But 15 seconds down to 5 ... that's good, yes?
Yes, but ... maybe the first query was run at 10am when everybody was online, and it's now 6pm and most people have left? Or someone has deleted a mass of data? Have you ever heard about plan caching? There are these variables to consider, and that's why we now go back to how initial snapshots.
I want you to go to the Messages tab in the SSMS Results pane and copy/paste that into the right side window of the text comparison tool you chose to use. Does it look something like this?
In my example here, you can see the logical reads on tblContactDetail dropped from 399,798 to 44,289! Now let's compare the Execution Plan? Copy/paste the XML into SQL Sentry and see what it shows. Here's mine for this example?
Ok, so there is still a LOT of work to do in this query to make it faster .. but you can see already the difference our new index has made.
Now .. the question is ... how much do we do? We got it from 15 seconds to 5. Is that enough?
If it's not, then it's a matter of rinse and repeat. You can choose, depending on your business' structure to put that new index into Production, wipe the slate clean, and start again with this new set of statistics and execution plan as a blank page, or keep working on this and deploy all at once.
But ... this is how I do it. I look at it big picture, and then pick off the low hanging fruit - missing indexes if there aren't many on the table, key lookups, functions on the WHERE clause etc ... and then go from there.
At some point, you end up where the amount of time and money it costs to get a query to optimal performance, isn't worth the cost to the business for the microseconds it might save.
It will all come down to experience.
So please, create a test environment, and experiment. But please don't do anything in a production environment until you're confident in what you're doing.
If you need any help, please reach out to me.
Rodney